Smurf Catcher: AML Scenario Simulation with Python, SQL & Power BI
- Ryan Deuter
- May 1, 2025
- 2 min read
I sought to simulate a scenario where transactions indicate structuring or smurfing. Using various tools, I aimed at improving how I would go about detecting financial malpractice in terms of AML analytics.
Link to dataset CSV: https://github.com/ryandeuter/PortfolioProjects/blob/main/test_data.csv
Link to Power BI file: https://github.com/ryandeuter/PortfolioProjects/blob/main/aml_smurf.pbix
BACKROUND: Test data set created using Python. Transaction history checked for structuring in SQL. Insights communicated with Power BI.
PROCESS: Using Google Collab, I started off importing Python libraries, such as pandas, datetime, timedelta, and random- libraries which were used to generate random data that represent structuring in AML.
# import libraries
import pandas as pd
from datetime import datetime, timedelta
import random
Next, I had to create a base time for the transactions, as well as some customer info.
base_time = datetime(2025, 4, 1, 9, 0)
customer_id = 'C123'
account_id = 'A456'
Then, I created 6 different deposits of under $10,000 spaced throughout the day.
transactions = []
for i in range(6):
txn_time = base_time + timedelta(hours=i*2)
amount = random.randint(9800, 9999)
transactions.append({
'transaction_id': f'TXN{i+1:03}',
'customer_id': customer_id,
'account_id': account_id,
'timestamp' : txn_time,
'amount' : amount,
'transaction_type' : 'Deposit'
})
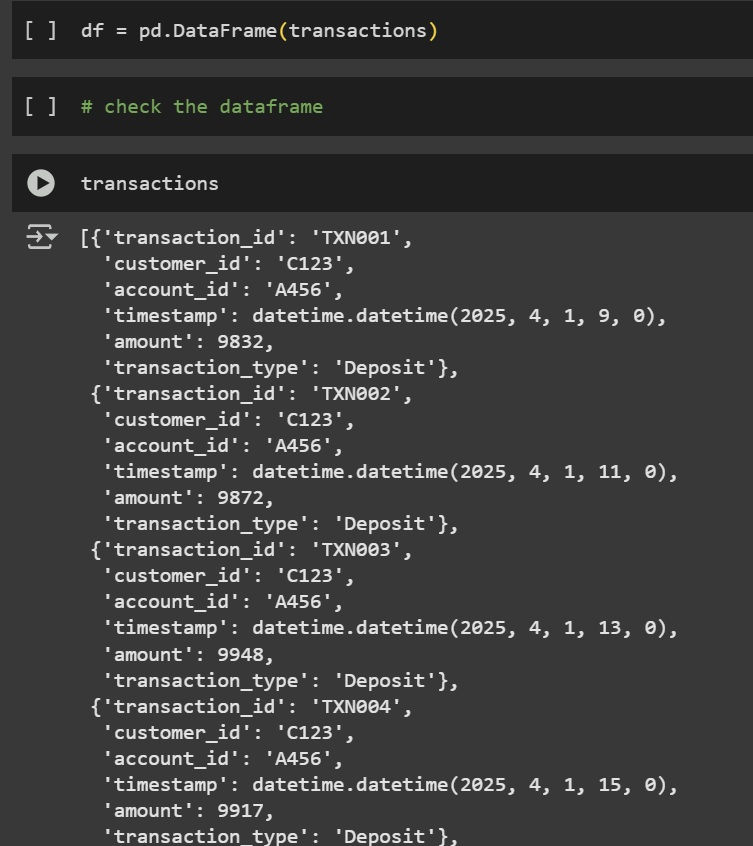
df = pd.DataFrame(transactions)So far, some of the data looks like this:
And for the final step in Python, I exported it to a CSV where I could investigate further in SQL.
df.to_csv('test_data.csv', index=False)
print("Test data saved as test_data.csv")
from google.colab import files
files.download('test_data.csv')
Opening up Microsoft SQL Server, I imported the CSV file:
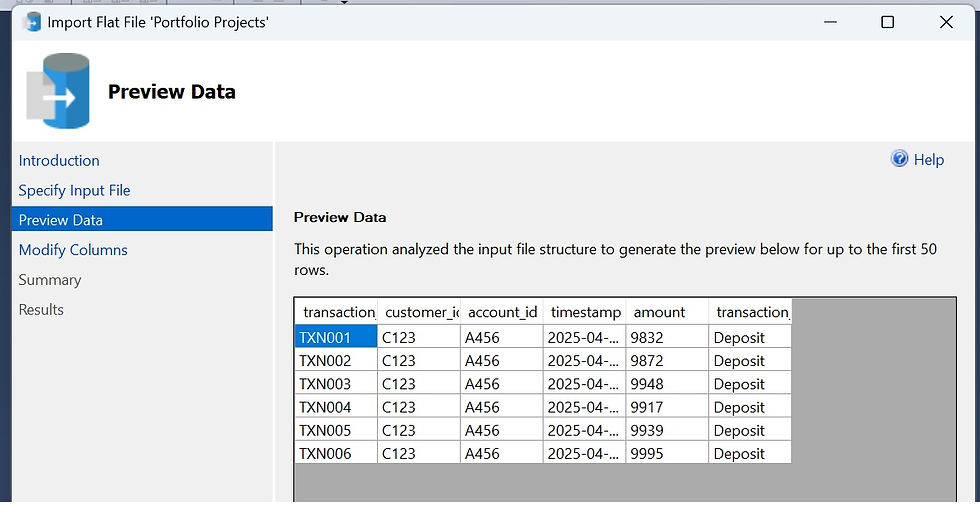
Next I ran a query to check all the data was there:
SELECT * FROM txn_dataI then chose to write the query that will check for structuring with a customer. I needed to check for amount of transactions, total amount, start and end times of transactions.
I also checked the total amount of transactions was 5 or more and the total amount was more than $45k.

Low and behold, the structuring suspicion is confirmed. Now, while this is a simulation setup with the sole purpose of recreating a structuring scenario and limiting the amount of data to highlight that, I believe the same process can be applied to larger datasets.
To add one final part to the project, I wanted to do some data visualizations in Power BI. The goal is to visualize how multiple sub-$10K deposits could indicate potential structuring behavior.
I imported the CSV, and in Power Query, I checked all the data types were ok in a data cleaning process. As this is a small dataset no removal of duplicates was no necessary. Everything else looked ok.

A line chart tracking deposit totals and times, a card visual with a total amount deposited, and a table with specific details were included to create the final dashboard.

Thank you very much for reading my project- I had a great time making it and learned a lot.
Please feel free to leave any comments below- I am always looking to improve.


Comments